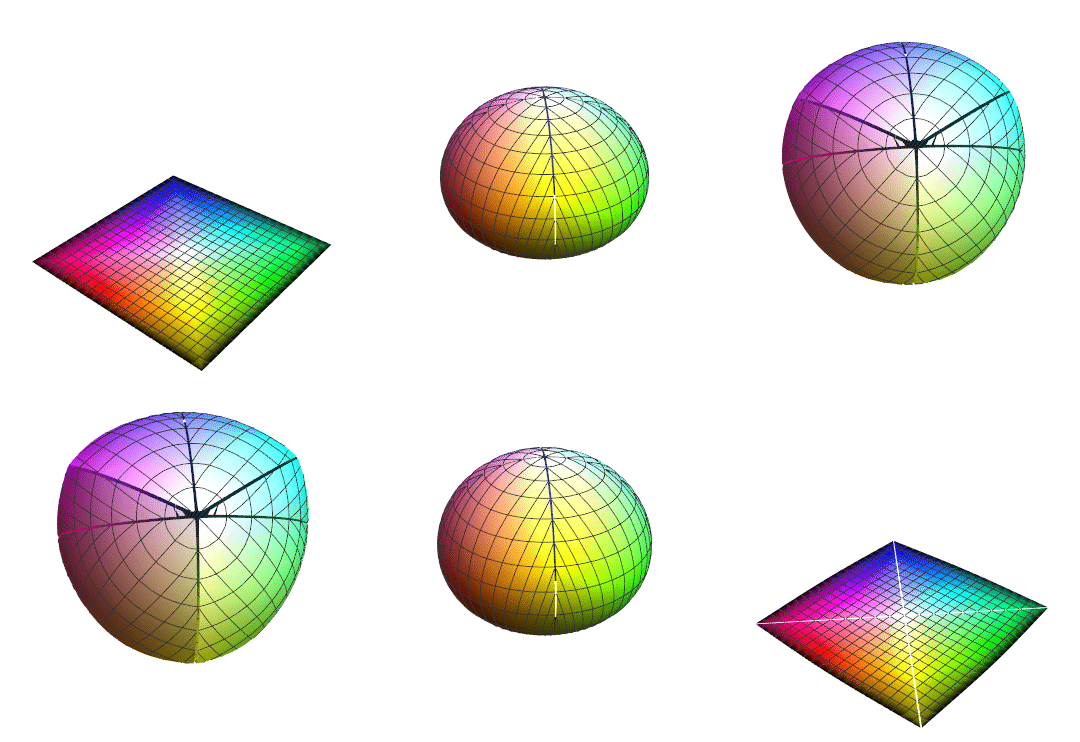
I plan to add this transformation to my upcoming book on computational geometry. This mapping was originally conceived to provide a one-to-one correspondence between RGB color and locations on a dance floor for a positioning correction in a project on robotic square dancers, but then we realized that simply laying down QR codes with coordinate and orientation data would be far more accurate.
 So what might be a good application for this transformation? It essentially maps the surface of the RGB cube (i.e., all fully saturated colors) to a square. One possibility would be to extend color plots that are conventionally used to depict one one variable to instead show two variables. In mechanics, for example, engineers typically show two different color plots for pressure and temperature, each with its own a linear legend bar ranging from a logical coordinate eta from 0 to 1, which is mapped to a selected linear color scheme (such as “hue” to range over the rainbow). In the single-variable color plots, the value of eta is set in proportion to the variable being plotted. To avoid needing two separate color plots for pressure and temperature a square color legend could be used with coordinates (eta1, eta2) associated with the two variables. While a “poor man’s” color plot mapping could be RGB[0,eta1,eta2], the one shown here would be far more spectacular because it would represent the full range of fully saturated colors (without “muddy” colors in the interior of the RGB cube) and, furthermore, values outside the range of interest would show as black.


