PowerPoint slides for Mohr’s circle

The link below provides a collection of slides used to explain Mohr’s circle in an undergraduate mechanics course at the University of Utah.  If you use a Mac, it is unlikely that these will render properly (so go sit at a PC in your university computer lab to look at them).  Make sure to use slideshow mode, as these have many animations!

MohrCircleFiles  (zip file contains two PPT lectures and one Mathematica file)

Delft Short Course: excerpts of discussion of basis and frame indifference

This posting links to a pdf,  DelftExcerpts, which contains slides taken from a 2004 short course given in TU Delft (Netherlands) on the mathematics of tensor analysis.  Following a review of the mathematics of line integrals, inexact differentials, and integrability, this set of slides provides some insight into the distinction between a global basis change (equivalent to the “space rotation” in the slides) and superimposed rotation.  It also provides an introduction to the principle of material frame indifference (PMFI) as it applies to restricting allowable forms and input/output variables of computational constitutive models.

Publication: Elements of Phenomenological Plasticity: Geometrical Insight, Computational Algorithms, and Topics in Shock Physics


This 2007 Book Chapter on the basics of plasticity theory reviews the terminology and governing equations of plasticity, with emphasis on amending misconceptions, providing physical insights, and outlining computational algorithms. Plasticity theory is part of a larger class of material models in which a pronounced change in material response occurs when the stress (or strain) reaches a critical threshold level. If the stress state is subcritical, then the material is modeled by classical elasticity. The bound- ary of the subcritical (elastic) stress states is called the yield surface. Plasticity equations apply if continuing to apply elasticity theory would predict stress states that extend beyond this the yield surface. The onset of plasticity is typically characterized by a pronounced slope change in a stress–strain dia-gram, but load reversals in experiments are necessary to verify that the slope change is not merely nonlinear elasticity or reversible phase transformation.
The threshold yield surface can appear to be significantly affected by the loading rate, which has a dominant effect in shock physics applications.

In addition to providing a much-needed tutorial survey of the governing equations and their solution (defining Lode angle and other Lode invariants and addressing the surprisingly persistent myth that closest-point return satisfies the governing equations), this book chapter includes some distinctive contributions such as a simple 2d analog of plasticity that exhibits the same basic features of plasticity (such as existence of a “yield” surface with associative flow and vertex theory), an extended discussion of apparent nonassociativity, stability and uniqueness concerns about nonassociativity, and a  summary of apparent plastic wave speeds in relation to elastic wave speeds (especially noting that non-associativity admits plastic waves that travel faster than elastic waves).

For the full manuscript with errata, click 2007 Book Chapter on the basics of plasticity theory.

Streamline visualization of tensor fields in solid mechanics

Stress net view of maximum shear lines inferred from molecular dynamics simulation of crack growth. Image from http://doi.ieeecomputersociety.org/10.1109/VIS.2005.33

Brazilian stress net before and after material failure. Colors indicate maximum principal stress (showing tension in the center of this axially compressed disk). Lines show directions of max principal stress.

A stress net is simply a graphical depiction of principal stress directions (or other directions derived from them, such as rotating them by 45 degrees to get the maximum shear lines.)  Continue reading

Exact solution for eigenvalues and eigenvectors/projectors of a real 3×3 symmetric matrix

The Pi (or Pie) Plane

The Pi (or Pie) Plane showing the region of the principal solution for the Lode angle and hence the region nearest the max eigenvalue.

It probably isn’t surprising that an exact solution can be found for eigenvalues of a real 3×3 symmetric matrix.  This conclusion follows from noting that the characteristic equation is cubic, for which an exact solution procedure can be found in any good algebra reference.  One thing that you won’t find in many such resources, however, is an algorithm for the solution that will avoid complex numbers in the intermediate steps of the calculation whenever the components of the source symmetric 3×3 matrix are all real.

Continue reading

Rate of Hencky (logarithmic) strain and similar tasks

The logarithmic (Hencky) strain is evaluated by taking the log of the symmetric stretch tensor in continuum mechanics. Doing so requires transforming to the principal stretch basis, taking logs of the principal stretch eigenvalues, and transforming the result back to the lab basis.  While this procedure is a bit tedious, it certainly is straightforward.

The harder — almost freakishly daunting — question is: how do you get the rate of the logarithmic strain?  This rate must include contributions from both the rate of the stretch eigenvalues and the rate of the stretch eigenvectors, which is difficult to handle when there are repeated eigenvalues causing extra ambiguity of eigenvectors.  Continue reading

Tutorial: multi-linear regression

The straight line is the linear regression of a function that takes scalars (x-values) as input and returns scalars (y-values) as output. (figure from GANFYD)

You’ve probably seen classical equations for linear regression, which is a procedure that finds the straight line that best fits a set of discrete points \{(x_1,y_1), (x_2,y_2),...,(x_N,y_N)\} . You might also be aware that similar formulas exist to find a straight line that is a best (least squares) fit to a continuous function y(x) .

The pink parallelogram is the multi-linear regression of a function that takes vectors (gray dots) as input and returns vectors (blue dots) as output

The bottom of this post provides a link to a tutorial on how to generalize the concept of linear regression to fit a function \vec{y}(\vec{x}) that takes a vector \vec{x} as input and produces a vector \vec{y} 
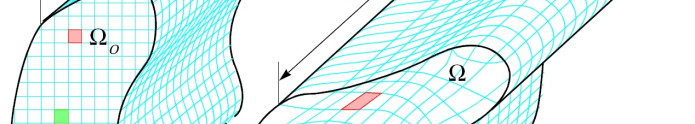
as output. In mechanics, the most common example of this type of function is a mapping function that describes material deformation: the input vector is the initial location of a point on a body, and the output vector is the deformed location of the same point. The image shows a collection of input vectors (initial positions, as grey dots) and a collection of output vectors (deformed locations as blue dots). The affine fit to these descrete data is the pink parallelogram. Continue reading

Publication: Determining a Surrogate Contact Pair in a Hertzian Contact Problem

Sanders, A. P. and R. M. Brannon (2011). “Determining a Surrogate Contact Pair in a Hertzian Contact Problem.” Journal of Tribology 133(2): 024502-024506.

Hertzian substitution concept: An arbitrary contact pair (a) with given principal curvatures and orientation, is substituted with a simpler contact pair (b) consisting of a spheroid and a plane

Laboratory testing of contact phenomena can be prohibitively expensive if the interacting bodies are geometrically complicated. This work demonstrates means to mitigate such problems by exploiting the established observation that two geometrically dissimilar contact pairs may exhibit the same contact mechanics. Specific formulas are derived that allow a complicated Hertzian contact pair to be replaced with an inexpensively manufactured and more easily fixtured surrogate pair, consisting of a plane and a spheroid, which has the same (to second-order accuracy) contact area and pressure distribution as the original complicated geometry. This observation is elucidated by using direct tensor notation to review a key assertion in Hertzian theory; namely, geometrically complicated contacting surfaces can be described to second-order accuracy as contacting ellipsoids. The surrogate spheroid geometry is found via spectral decomposition of the original pair’s combined Hessian tensor. Some numerical examples using free-form surfaces illustrate the theory, and a laboratory test validates the theory under a common scenario of normally compressed convex surfaces. This theory for a Hertzian contact substitution may be useful in simplifying the contact, wear, or impact testing of complicated components or of their constituent materials.

Available Online:

http://www.mech.utah.edu/~brannon/pubs/7-2011-SandersBrannon-IJT.pdf

http://scitation.aip.org/getabs/servlet/GetabsServlet?prog=normal&id=JOTRE9000133000002024502000001&idtype=cvips&gifs=yes&ref=no

Publication: Decomposition and Visualization of Fourth-Order Elastic-Plastic Tensors

A.G. Neeman; R.M. Brannon; B. Jeremic; A. Van Gelderand;  A. Pang

Top view (Z from above) of eigentensors for Drucker-Prager material, time step 124, colored by minimum stretch eigenvalue.

Visualization of fourth-order tensors from solid mechanics has not been explored in depth previously. Challenges include the large number of components (3x3x3x3 for 3D), loss of major symmetry and loss of positive definiteness(with possibly zero or negative eigenvalues). This paper presents a decomposition of fourth-order tensors that facilitates their visualization and understanding. Fourth-order tensors are used to represent a solid’s stiffness.The stiffness tensor represents the relationship between increments of stress and increments of strain. Visualizing stiffness is important to understand the changing state of solids during plastification and failure. In this work,we present a method to reduce the number of stiffness components to second-order 3×3 tensors for visualization.The reduction is based on polar decomposition, followed by eigen-decomposition on the polar “stretch”. If any resulting eigenvalue is significantly lower than the others, the material has softened in that eigen-direction. The associated second-order eigentensor represents the mode of stress (such as compression, tension, shear, or some combination of these) to which the material becomes vulnerable. Thus we can visualize the physical meaning of plastification with techniques for visualizing second-order symmetric tensors.

Available Online:

Publication: http://www.mech.utah.edu/~brannon/pubs/7-2008NeemanBrannonJeremicVanGelderPang.pdf

Poster: http://www.mech.utah.edu/~brannon/pubs/7-09NeemanBrannonEtAlNEESposter.pdf