A. Sadeghirad, R. M. Brannon, and J. Burghardt

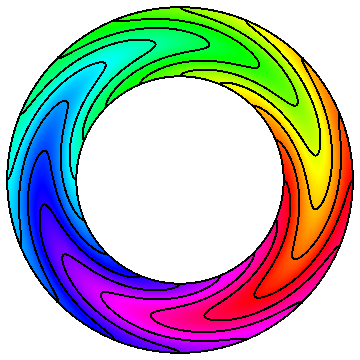
Three snapshots of the model with 248 particles in simulation of the radial expansion of a ring problem using: (a) CPDI method and (b) cpGIMP
A new algorithm is developed to improve the accuracy and efficiency of the material point method for problems involving extremely large tensile deformations and rotations. In the proposed procedure, particle domains are convected with the material motion more accurately than in the generalized interpolation material point method. This feature is crucial to eliminate instability in extension, which is a common shortcoming of most particle methods. Also, a novel alternative set of grid basis functions is proposed for efficiently calculating nodal force and consistent mass integrals on the grid. Specifically, by taking advantage of initially parallelogram-shaped particle domains, and treating the deformation gradient as constant over the particle domain, the convected particle domain is a reshaped parallelogram in the deformed configuration. Accordingly, an alternative grid basis function over the particle domain is constructed by a standard 4-node finite element interpolation on the parallelogram. Effectiveness of the proposed modifications is demonstrated using several large deformation solid mechanics problems.
Available Online:
http://www.mech.utah.edu/~brannon/pubs/7-2011-SadeghiradBrannonBurghardt-NME.pdf
http://onlinelibrary.wiley.com/doi/10.1002/nme.3110/abstract